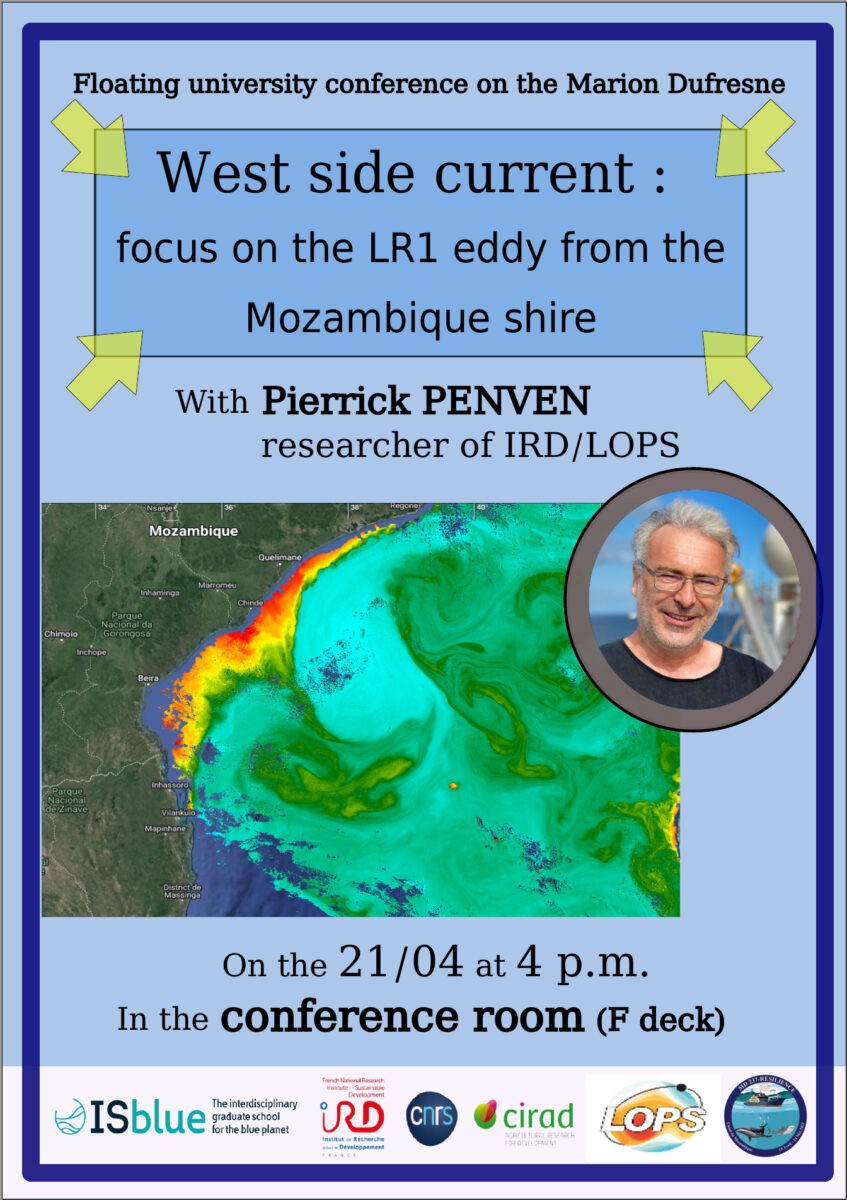
Conference by Pierrick Penven – Western boundary currents and eddies in the Mozambique Channel
April 21st, 2022, R/V Marion Dufresne, off the Reunion Island
Authors: Luis Chomienne and Manon Gibaud
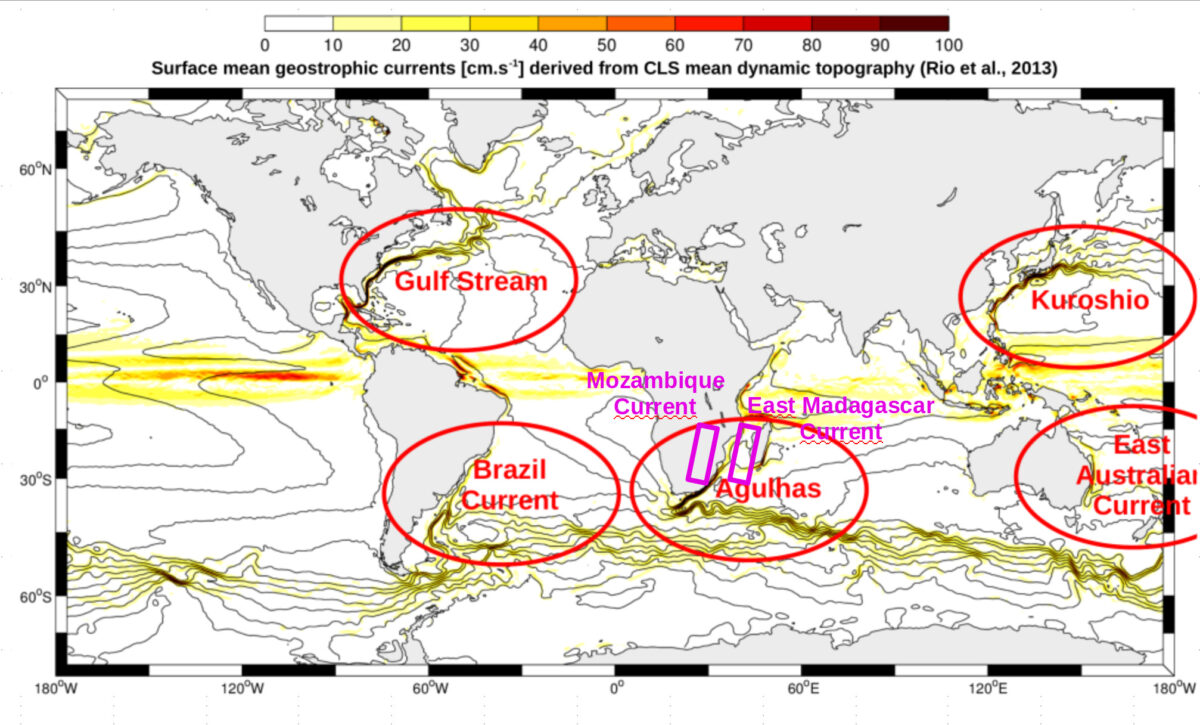
Pierrick Penven is an ocean physics researcher at the Research and Development Institute in France and during his seminar he presented us the effects of western boundary currents (WBCs). WBCs are return currents created from the ocean gyres (the large circulation in the ocean basins) at the eastern margins of continental shelves and are characterized by hot and fast flowing narrow currents heading to the poles. We distinguish 5 majors WBCs: the Gulf Stream current, the Brazil current, the Eastern Australian current, the Kuroshio current, and the Agulhas current. There are many further smaller WBCs that include the Mozambique channel current and the East Madagascar current (Figure 1).
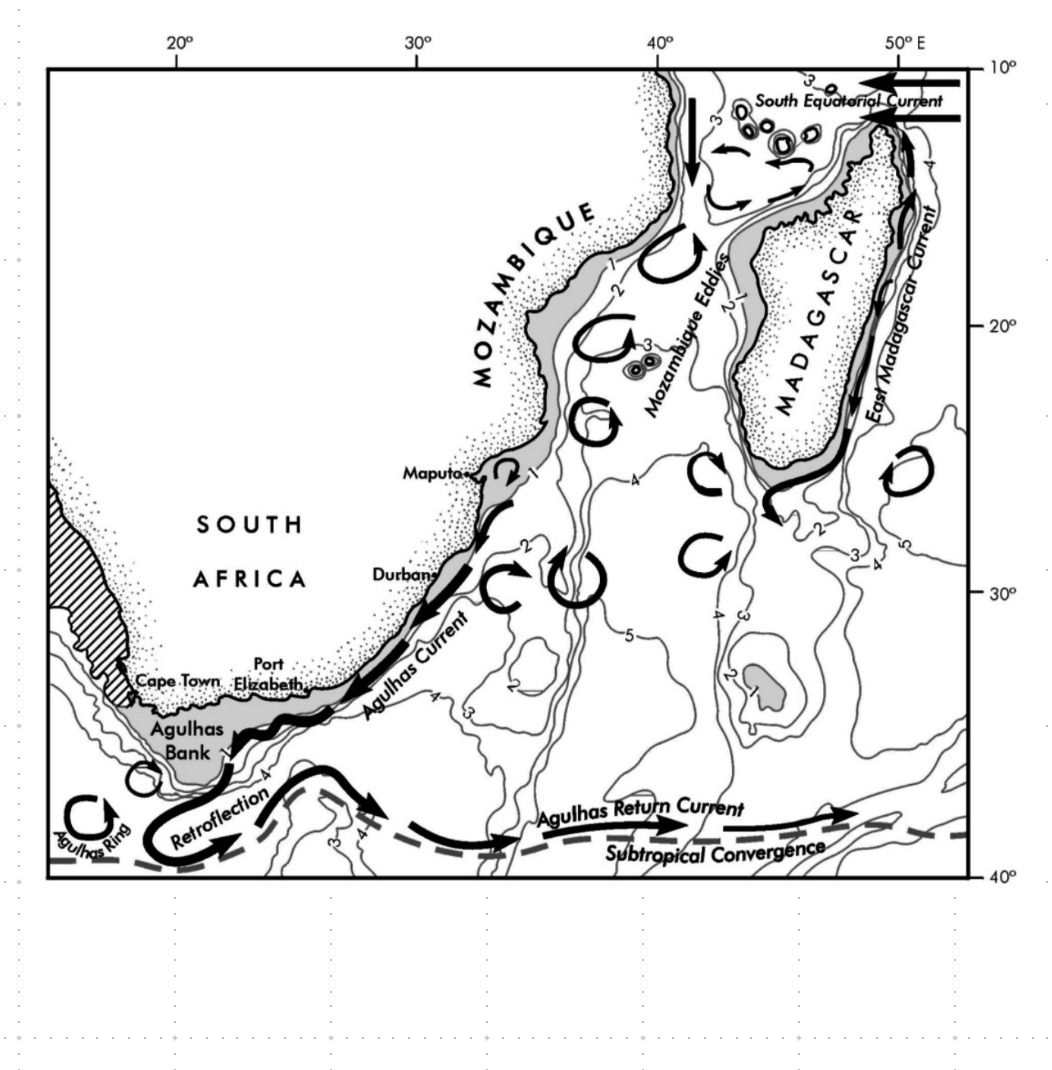
The WBCs have direct effects on climate and on marine life. They are hotspots of carbon dioxide absorption (CO2) and ocean heat loss to the atmosphere. By transporting warm waters to high latitudes, they induce warmer and humid climates, associated to rain and intense winds. Multiple circular current structures, called eddies, form in the northern part of the Mozambique channel (Figure 2). These are notably anticyclonic eddies which rotate anticlockwise. These structures can be larger than 200 km in diameter and reach 2km of depth, with strong water flow speed from 1 to 2 meters per second (that’s a lot in the ocean)! Eddies are important for marine life, also because they induce vertical movements in the ocean. Eddies can either induce upwellings (flow of water going up) or downwellings (flow of water going to deeper water layers), depending on their origin and form. Eddies formed in the Mozambique Channel move south until the Agulhas current, where they “die” off. There are lots of interactions between topography and water masses with different temperatures and salinity, which creates theses instabilities in the water column.
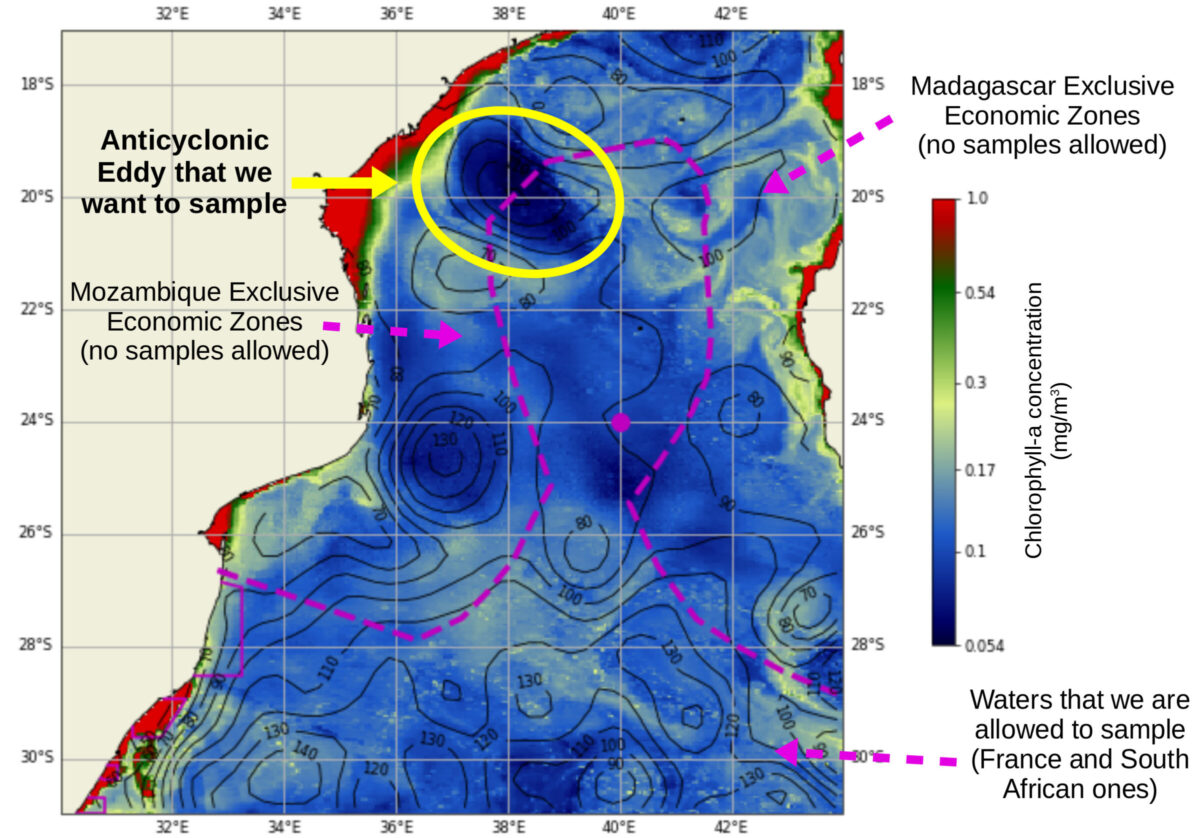
Pierrick and his team uses near real time satellite data to locate the eddies, which are continuously moving and changing, and define where to sample exactly (in this process they need a lot of WiFi). Eddies can be detected from different satellites images: altimetry, salinity, or chlorophyll concentration showing distribution of living phytoplankton, the micro-algae at the basis of the food-web. However, Chlorophyll satellite data are limited by clouds coverage. Consequentially, if the weather is cloudy (which is often the case due to the tropical climate) Pierrick’s team cannot have this precious information. Pierrick and his team also use models to forecast the position of the eddies in the future days and better plan our sampling stations. Models discretise the space for resolving very complex equations in a kind of a matrix area. With these analyses they can evaluates the vorticity and look at the eddies which can have cyclonic or anticyclonic rotations.
During this RESILIENCE cruise on Marion Dufresne, we will be doing the first “leg” (our first sampling marathon) on an eddy in the Mozambique Channel (figure 3). This eddy is near the Mozambique coast and thus export some coastal waters, characterized by higher chlorophyll and lower salinity, offshore and into the eddy. After this first leg on the eddy, we will continue until the start of Agulhas current off of the South African coast to sample the genesis of this WBC (leg 2). Finally, we will navigate southward to sample a semi-permanent eddy constrained by the bathymetry off Durban (South Africa) for our last leg of the mission.
Bibliography :
Lutjeharms, J.R.E, 2006. The coastal oceans of south-eastern Africa. In: Robinson, A. R., Brink, K.H (Eds.), The sea, vol 14B. JohnWiley, NewYork, pp. 783-834
Rio, M. H., Mulet, S., & Picot, N. (2013, September). New global Mean Dynamic Topography from a GOCE geoid model, altimeter measurements and oceanographic in-situ data. In Proceedings of the ESA living planet symposium, Edinburgh.
 Attention, vous utilisez un navigateur peu sûr !