Why and what is the leg 1 ?
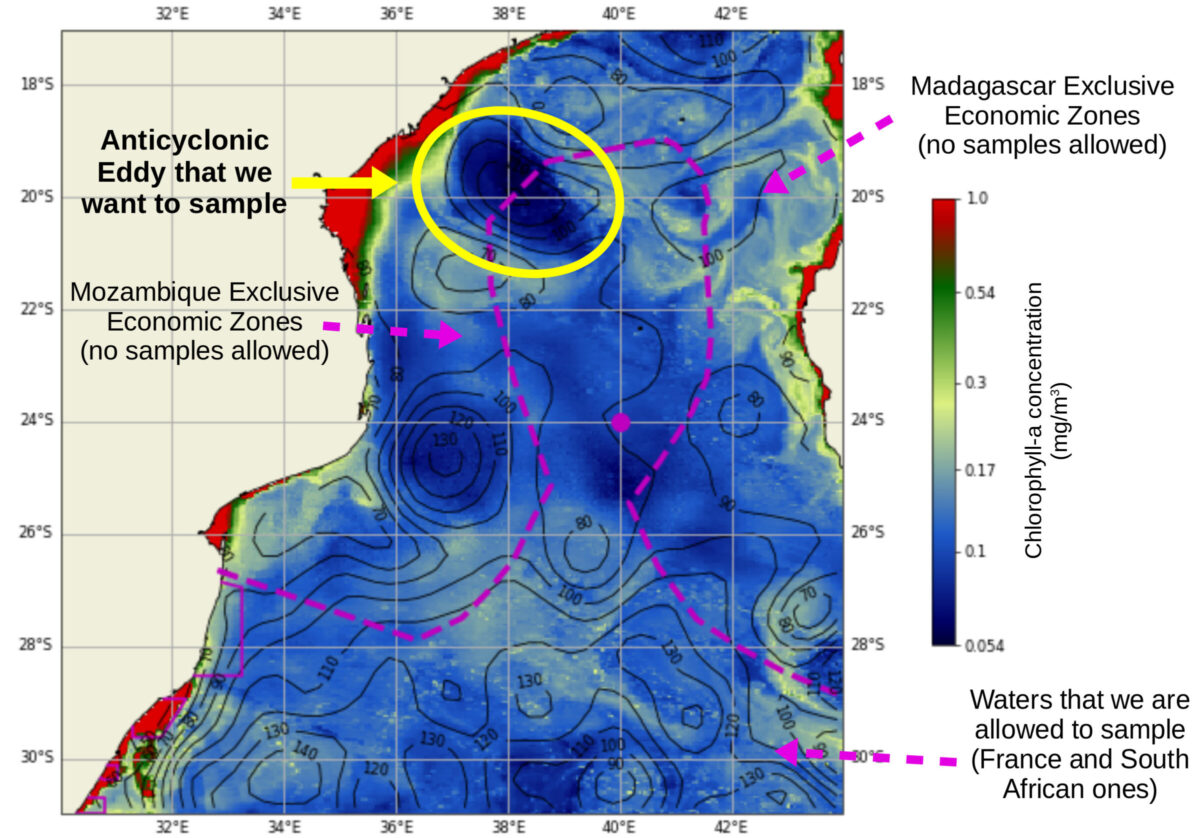
You must have read us writing about sampling on the Leg 1, and we hope that you understood we are not sampling a huge sea human leg. So what is a Leg? It is a range of operations performed for achieving scientific objectives, in our case we wanted to study the biological, physical and chemical processes associated to an anticyclonic eddy (a rotating feature rotating counter-clockwise) in the Northwest part of the Mozambique Channel (Figure 1).
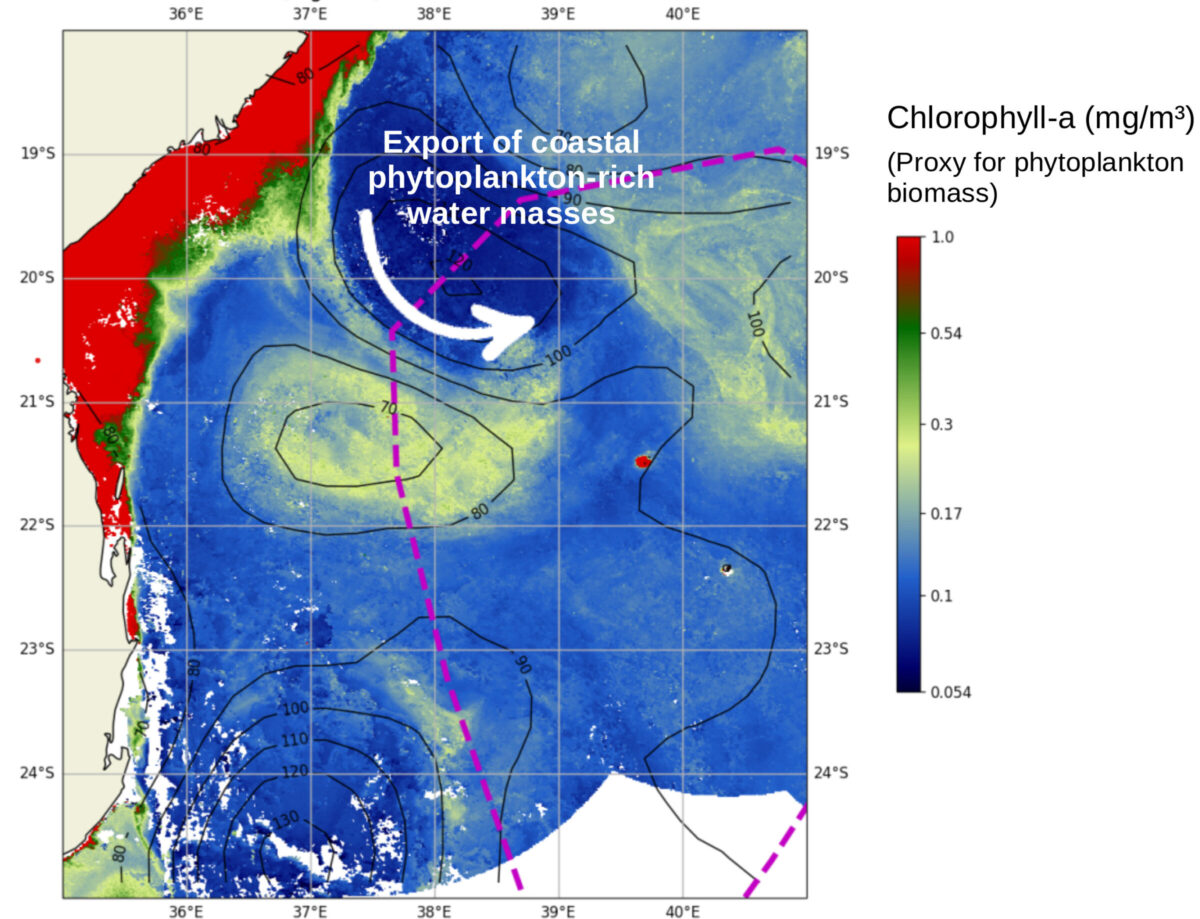
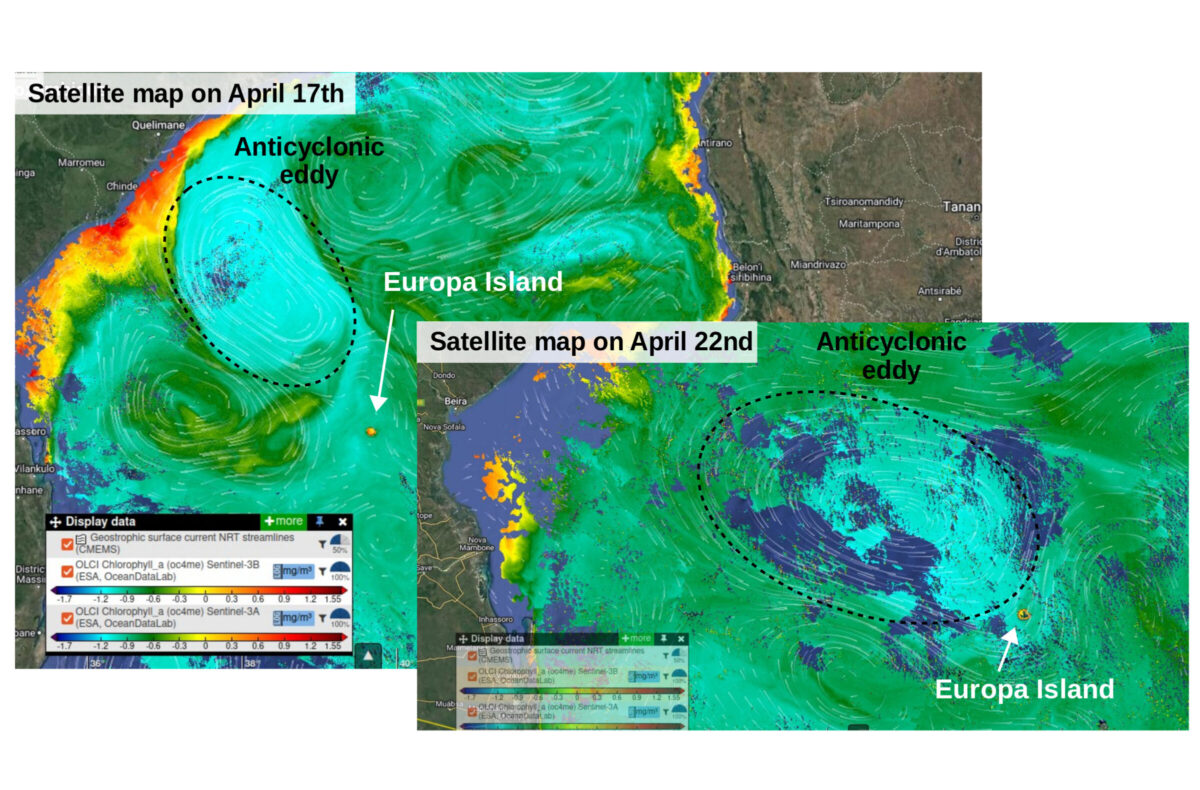
Eddies can have important effects on marine life due to, among others, vertical and horizontal movements or mixing processes associate to them. In our case, satellite images show that the anticyclonic eddy is associated to an export of offshore coastal water masses enriched in chlorophyll (= pigment, indicator for phytoplankton biomass). This export of phytoplankton biomass is occurring at the interface between the anticyclonic eddy, and a cyclonic one south of it (figure on the left).
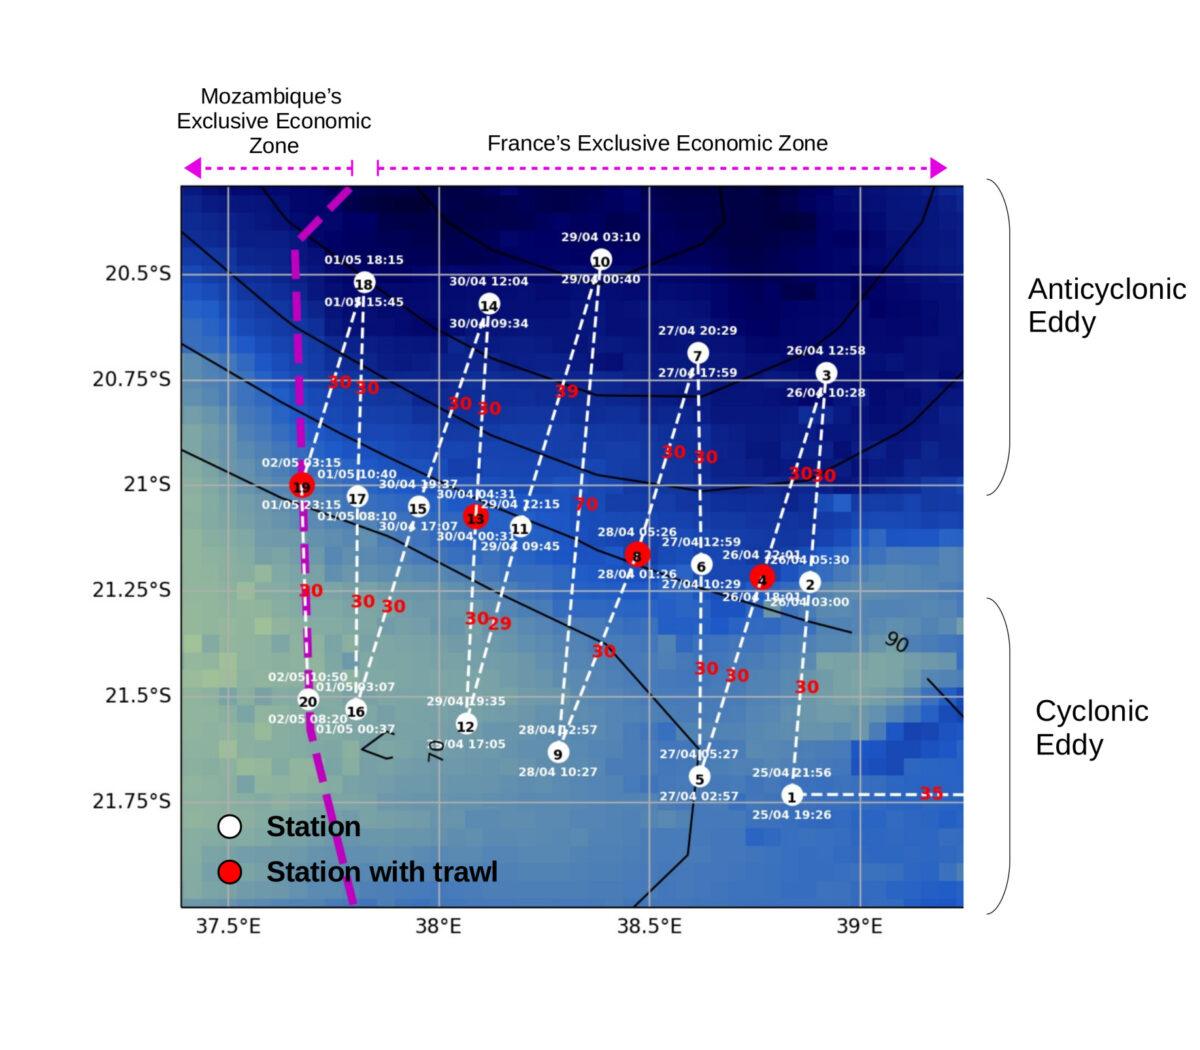
Based on satellite data we prepared a sampling strategy with 20 stations in order to get high resolution observations of the processes occurring in the anticyclonic eddy (from the edge to its center), and the interfaces between the two eddies.
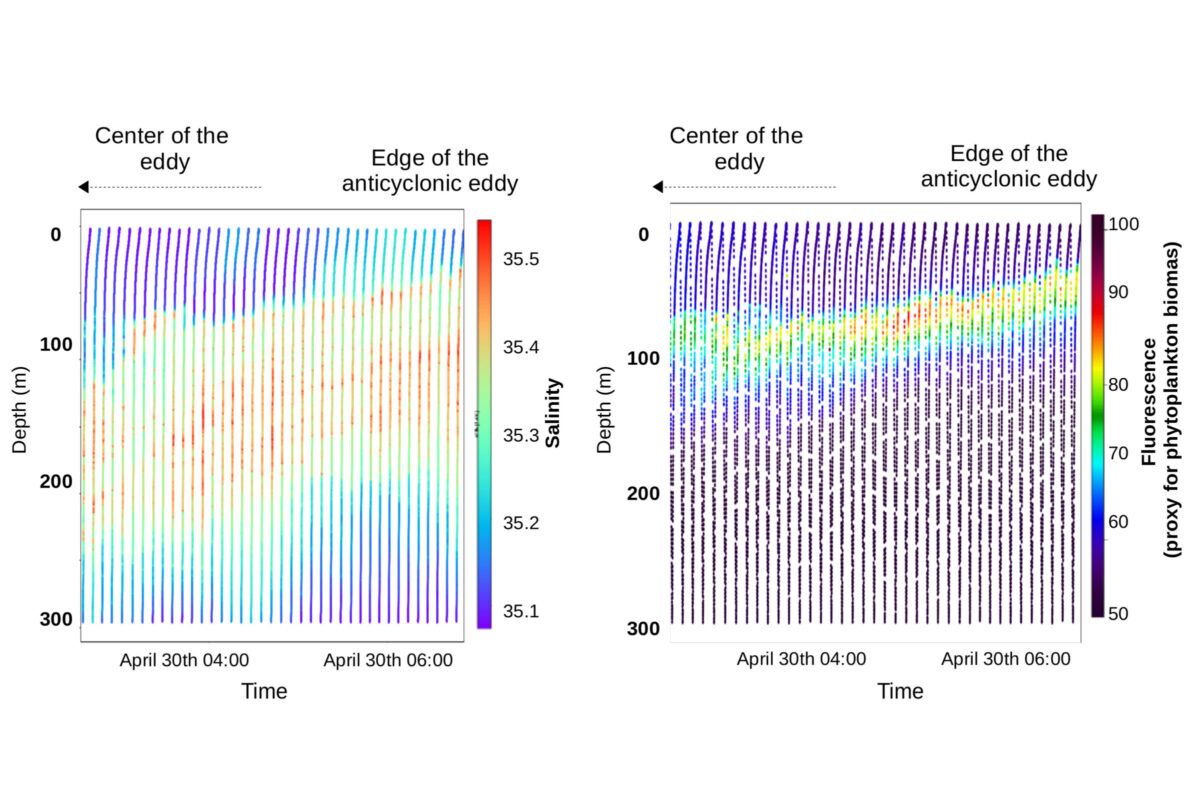
In the figures below you can see the sloping of the water masses associated to the edge of the eddies: water masses with higher salinity and more phytoplankton are shallower close to the anticyclonic eddy edge. These data when added with additional observation both physical (e.g. currents, temperatures), biological (e.g. zooplankton, fishes, squids, marine mammals) and chemical (e.g. nutrients) allow us to characterize at small scales the processes associated to these dynamical structures.
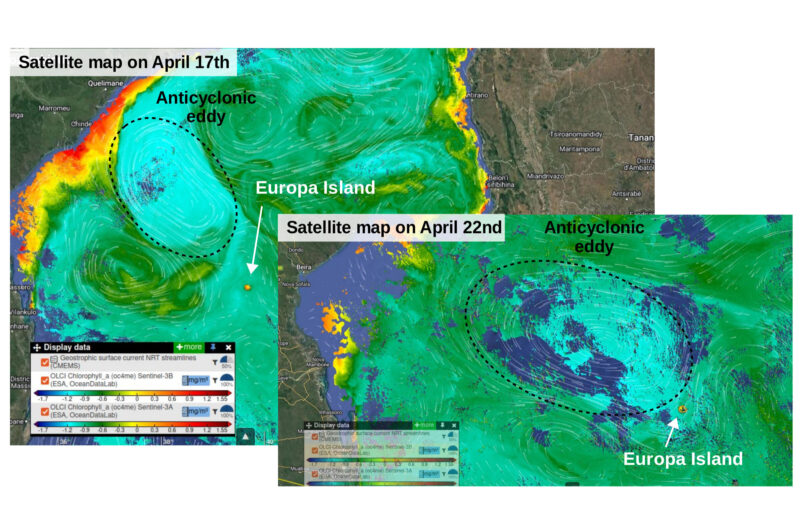
During the Leg1 we continuously re-adapted our sampling strategy: as for instance we discovered that the eddy was moving fast (more than though) eastward (you can look at its displacement in figure 5 with the eddy coming closer to Europa Island)! This is not surprising, we are in a continuously moving ocean. Its dynamics makes our sampling strategies challenging but it’s also what makes our researches so fascinating!
 Attention, vous utilisez un navigateur peu sûr !